–News Direct–
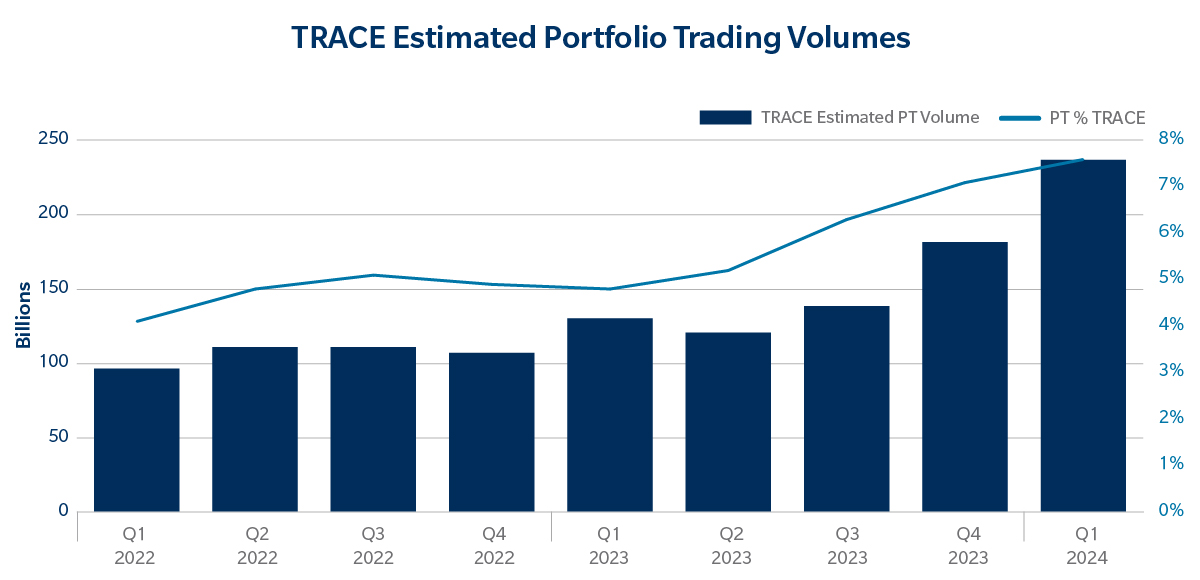
U.S. credit portfolio trading (PT) volumes have grown significantly over the past few years, with record volumes recorded through the first quarter of 2024 across the market as a whole and on the Tradeweb platform. As usage of the protocol evolves and new use cases arise, we continue to monitor the critical trends in portfolio trading and how they are impacting U.S. credit markets today.
This analysis will explore one of the key drivers of the portfolio trading evolution: execution quality. As we discussed in a previous piece, execution quality can have many dimensions. In this piece, we will focus on the transaction cost – defined as the price paid for the basket versus market mid. We will delve into the core factors, including various portfolio trade construction and market factors, which influence trading costs and their implications for portfolio trading on Tradeweb.
Bid/Offer Spread
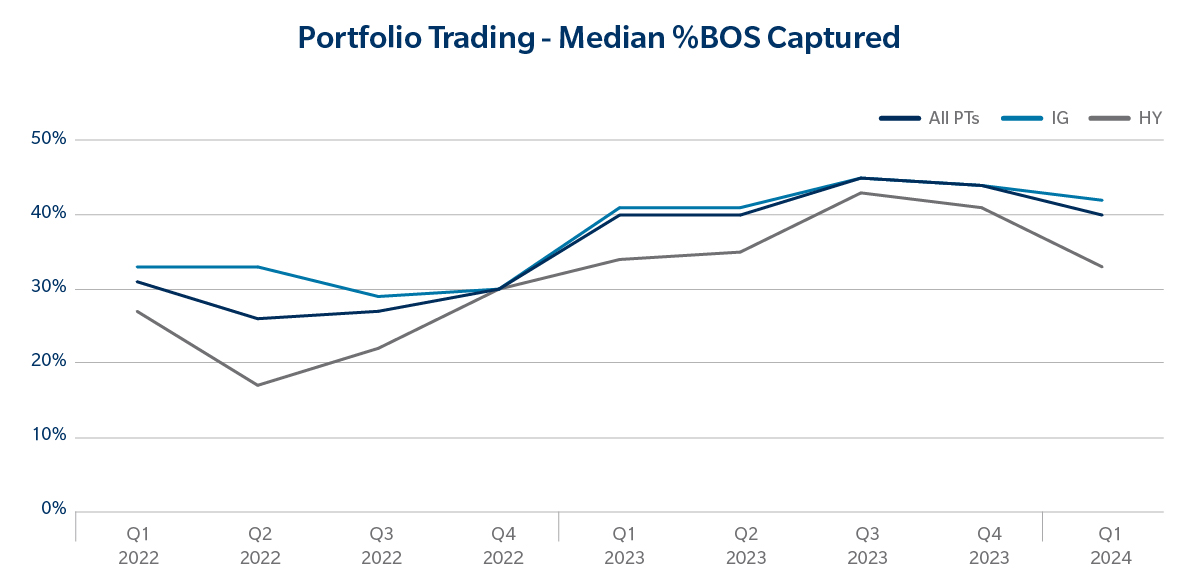
First, lets look at measuring execution quality. We do this by calculating the percentage bid/offer spread (%BOS) captured in each trade by determining the gap between the Tradeweb Ai-Price bid/offer spread and the actual level of each completed trade. We use this metric to normalize the bid/offer spread across the liquidity spectrum. Within this construct, execution where the client is paying full bid/offer is represented as 0% and execution at Mid is 50%.
As the chart below illustrates, weve seen a steady improvement in execution quality over the last couple of years, with %BOS captured trending around 40-45%, up from roughly 30% in 2022. This trend demonstrates that as portfolio trading volumes and adoption have grown, dealers have become more comfortable pricing their baskets competitively, with clients now trading closer to Mid than in years prior.
Role of Pre-Trade Data
The importance of reliable pre-trade data has also become an increasingly critical component in global credit markets. This theme is relevant throughout the trade life cycle in portfolio trading, beginning at the portfolio manager level, where it is used to help determine which bonds should be traded, and at the execution level, where it is used to help determine which dealers should receive the list.
As leaders in portfolio trading, we have an abundance of reliable trade data to examine trends in execution quality and what they mean for the markets overall. We analyzed thousands of portfolio trades over dozens of attributes to identify the factors that proved to be statistically significant in explaining execution quality. These factors are broadly categorized as Portfolio and Market Factors:
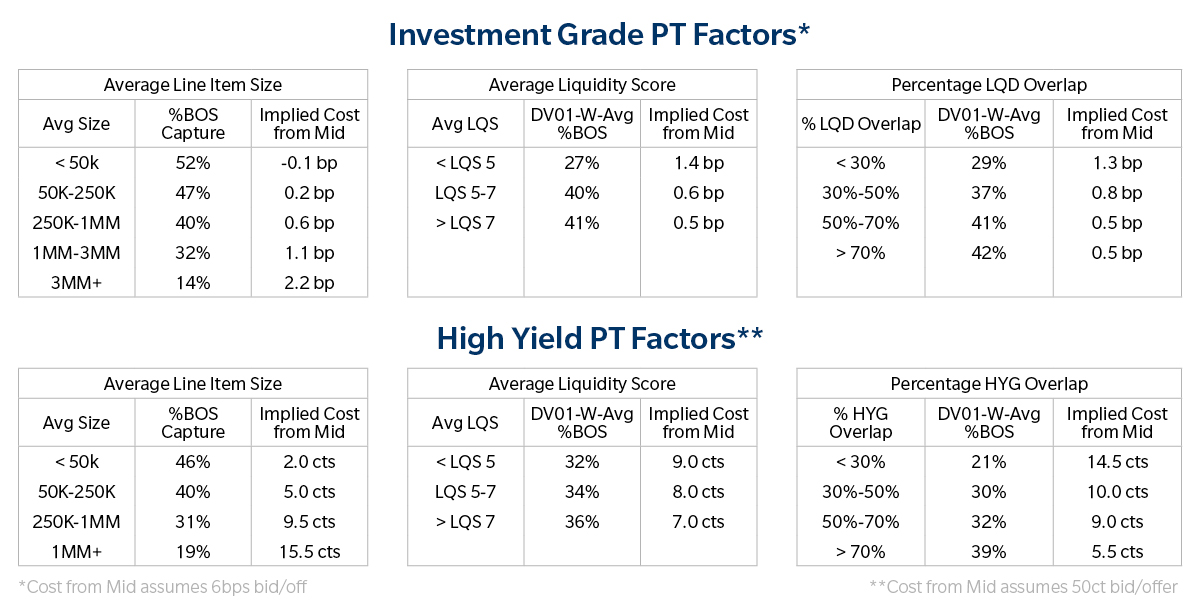
- Portfolio Factors are properties the client can control within their portfolio trade construction. The most significant drivers within these factors were average line item size, weighted average liquidity score and ETF overlap; the percentage of bonds in a portfolio trade that are also constituents in the relevant ETF. For this analysis, we compared portfolio trades to iShares ETFs (LQD for Investment Grade portfolios and HYG for High Yield portfolios).
- Market Factors are properties outside the clients control due to overall market conditions. The market factor that stood out the most was the ETF premium/discount at the time of execution.
Portfolio Trade Construction Matters
Digging deeper into these categories, if we look at the median %BOS captured across these baskets for each determining factor, we can begin to understand how these metrics drive execution quality.
As outlined in the tables below, we see that as the notional per line item increases, the expected cost of the whole basket increases. This trend is not surprising, because it generally costs more to trade larger size risk. When that large size is spread over many line items at the basket level, the overall cost to trade the basket goes down. In terms of liquidity, generally, if a basket is more liquid, it will cost less to trade.
The results around the ETF overlap are also intuitive. Generally, the closer to an ETF the portfolio trade is, the easier for dealers to hedge and price the basket.
How do these portfolio construction factors interact?
We can see from the tables above how the factors individually affect overall trade execution. However, it is also necessary to know how these factors interact as the effect of one factor may depend on others. We find this easiest to interpret if we analyze the execution quality from each bucket combination.
Consider the table below. It illustrates that, on average, the best execution for investment grade portfolios is achieved when baskets have a size of less than 50,000 per line item and average liquidity score greater than seven and an LQD ETF overlap of more than 70%. This implies that by optimizing basket construction across all three metrics, its possible to attain better expected execution costs (0.4bp better than mid in the below example) than is implied by optimizing any one metric (0.1bp better than mid shown in the Average Line Item Size table above). This trend is also observed in High Yield (HY) portfolios.

Market Factors The ETF Premium/Discount Effect
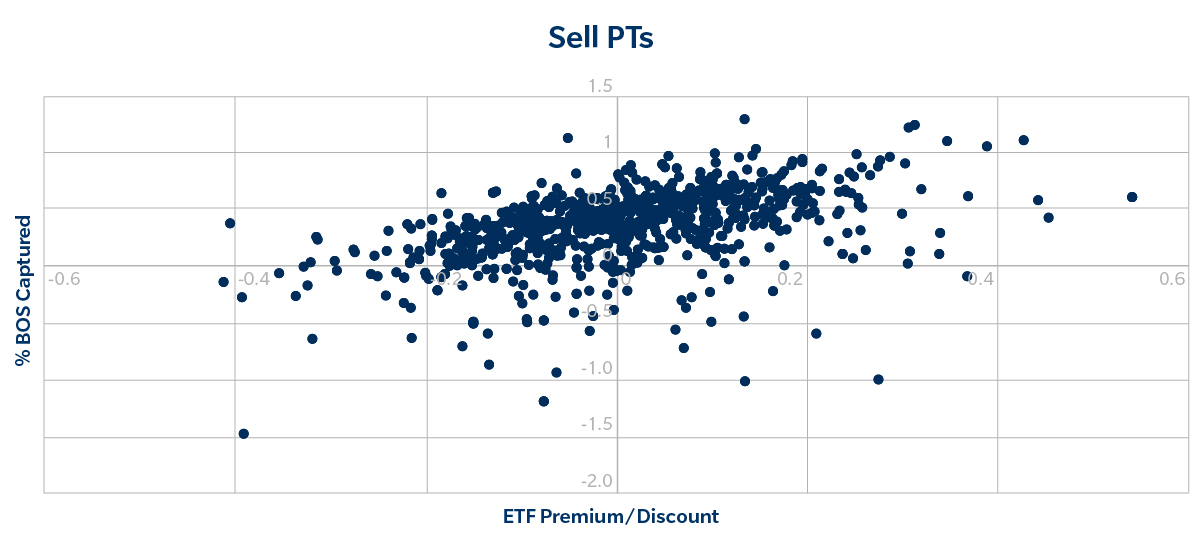
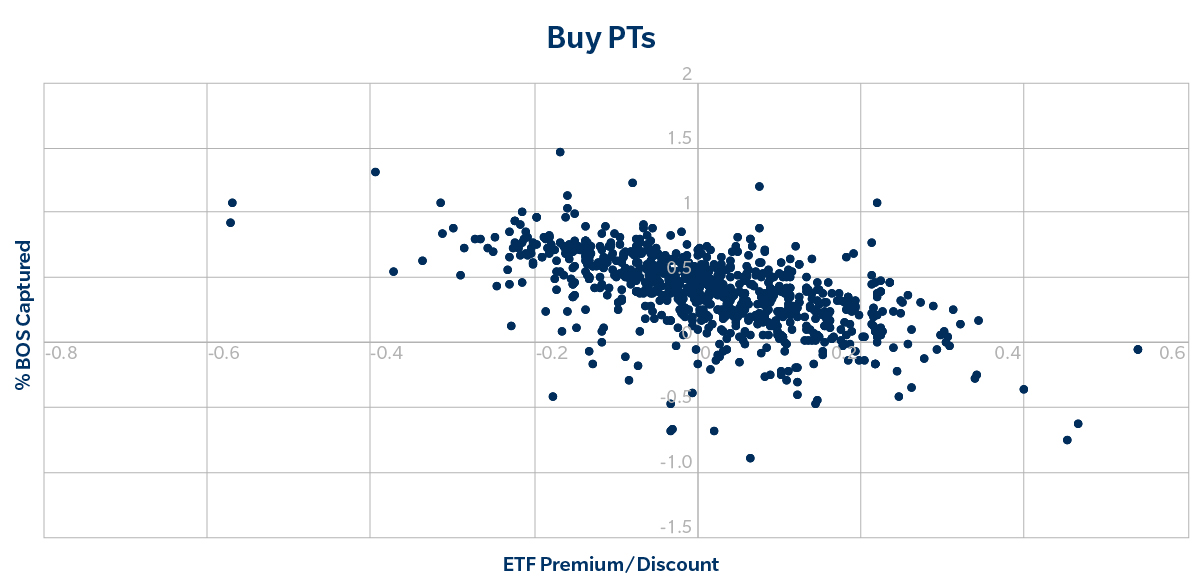
We also found that the premium/discount between the ETF market price and the intraday Net Asset Value (iNAV) of the underlying constituent bonds is essential in explaining overall trade cost.
For example, consider a scenario where the constituent LQD bonds traded cheaper than LQD on the exchange. This market dislocation could prompt dealers to buy bonds to create shares of LQD, which they could then sell in the secondary market at a higher level than the underlying value of the bonds. Therefore, we found that if clients were selling (buying) portfolios when the bonds were cheaper than the ETF, they received better (worse) pricing.
The upward slope on the chart below demonstrates this effect; as the premium gets larger, execution quality improves when clients are selling. This effect was symmetric for clients buying bonds from dealers when they were more expensive than the ETF, as shown by the downward slope below.
Conclusion
This analysis shows that portfolio composition and market-driven factors are essential in predicting a range in which a basket might typically trade. Tradeweb has taken these findings and incorporated them into our new pre-trade analytics for portfolio trading. By using these tools, clients can gain further insight into what drives execution quality and fine-tune portfolio trade construction, potentially unlocking more liquidity at better prices.
About Tradeweb Markets
Tradeweb Markets Inc. (Nasdaq: TW) is a leading, global operator of electronic marketplaces for rates, credit, equities and money markets. Founded in 1996, Tradeweb provides access to markets, data and analytics, electronic trading, straight-through-processing and reporting for more than 50 products to clients in the institutional, wholesale and retail markets. Advanced technologies developed by Tradeweb enhance price discovery, order execution and trade workflows while allowing for greater scale and helping to reduce risks in client trading operations. Tradeweb serves more than 2,500 clients in more than 70 countries. On average, Tradeweb facilitated more than $1.5 trillion in notional value traded per day over the past four fiscal quarters. For more information, please go to www.tradeweb.com.
Forward-Looking Statements
This release contains forward-looking statements within the meaning of the federal securities laws. Statements related to, among other things, our outlook and future performance, the industry and markets in which we operate, our expectations, beliefs, plans, strategies, objectives, prospects and assumptions and future events are forward-looking statements.We have based these forward-looking statements on our current expectations, assumptions, estimates and projections. While we believe these expectations, assumptions, estimates and projections are reasonable, such forward-looking statements are only predictions and involve known and unknown risks and uncertainties, many of which are beyond our control. These and other important factors, including those discussed under the heading Risk Factors in documents of Tradeweb Markets Inc. on file with or furnished to the SEC, may cause our actual results, performance or achievements to differ materially from those expressed or implied by these forward-looking statements. Given these risks and uncertainties, you are cautioned not to place undue reliance on such forward-looking statements. The forward-looking statements contained in this release are not guarantees of future performance and our actual results of operations, financial condition or liquidity, and the development of the industry and markets in which we operate, may differ materially from the forward-looking statements contained in this release. In addition, even if our results of operations, financial condition or liquidity, and events in the industry and markets in which we operate, are consistent with the forward-looking statements contained in this release, they may not be predictive of results or developments in future periods.Any forward-looking statement that we make in this release speaks only as of the date of such statement. Except as required by law, we do not undertake any obligation to update or revise, or to publicly announce any update or revision to, any of the forward-looking statements, whether as a result of new information, future events or otherwise, after the date of this release.
Contact Details
Tradeweb Media Contact
Savannah Steele
+1 631-655-4225
Company Website
View source version on newsdirect.com: https://newsdirect.com/news/analyzing-execution-quality-in-portfolio-trading-587273413
Tradeweb
COMTEX_451775680/2655/2024-05-02T09:29:03
Disclaimer: The views, suggestions, and opinions expressed here are the sole responsibility of the experts. No Top 10 Digest journalist was involved in the writing and production of this article.
